|
|
|
|
|
|
|
| You are here : Home > Articles > Page 4 > Ultimate Price Momentum Series Study - Part 1 |
| ULTIMATE PRICE MOMENTUM SERIES STUDY - PART 1 |
| |
|
What is the Ultimate Price Momentum Series?
The Ultimate Price Momentum Series is a family of
Canadian stock portfolios that derives from the former Price Momentum Weekly
portfolio. On top of the orders generated by the Price Momentum Weekly
portfolio, the Ultimate Price Momentum portfolios add a delay filter of
various lengths.
5 different portfolios are featured in this family,
the Ultimate Price Momentum v1 adds a 1-week delay filter, the Ultimate
Price Momentum v2 adds a 2-week delay filter and so on until the Ultimate
Price Momentum v5 that adds a 5-week delay filter.
The filter works as follow: if a stock is bought by
the Price Momentum Weekly for less than the value of the filter
delay of one of the Ultimate Price Momentum portfolio, then this buy order
is ignored. It is only when the stock has been hold for more than the
filter delay that the buy order is issued in the corresponding
Ultimate Price Momentum portfolio (and only if the stock would not be sold
the same day by the Price Momentum Weekly portfolio). Once a stock is hold
by one of the Ultimate Price Momentum portfolio, the sell order is issued
the same day as the sell order dealing with the same stock in the Price
momentum Weekly portfolio.
|
| |
|
Why the Ultimate Price Momentum Series?
Following our observations and your feedback, we
thought that we could find a way to remove some of the poor trades that the
Price Momentum Weekly generates. It appears that very few of the short term
trades generated by our stock picking strategy were good and that it would
be more profitable to exclude them. Hence, the idea of adding a delay
filter to the raw orders.
But adding a delay filter also means changing the
returns of our good trades (the longer term ones that will stay after the
filtering). Then, to sense how good or bad this change of strategy would be
and to help you to choose which portfolio from this family best suits your
investment philosophy, this study has been done.
|
| |
|
How has the study been run?
Based on the fact that the new Ultimate Price
Momentum portfolios are directly derived form the orders of the former Price
Momentum Weekly portfolio, it has been possible to filter those historical
orders in order to back-test our Ultimate portfolios. Therefore, the
historical performances of the new portfolios have been deducted from these
new sets of orders.
|
| |
|
What are the results of the study?
The study deals with four topics: the
performances improvement, the lower volume of orders, the reduced number of
holdings and the increased volatility of the Ultimate Price Momentum
portfolios.
Note that the study has been done with the data
in date of the March 17, 2005.
This was the primary objective of the new portfolio
family. Removing the short term trades that were for most of them non-profitable
should help to improve the return of our portfolios. But, as it
also affects the return of the good trades, it was important to back-test
the new portfolios carefully.
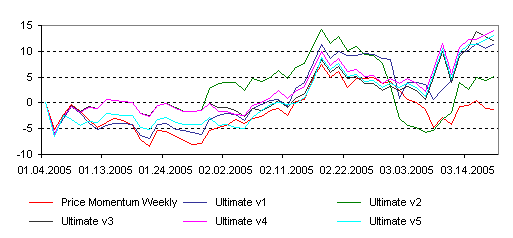
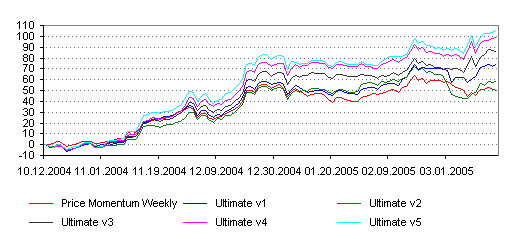
The following graphics show the return of the
portfolios on two different time frames:

Ultimate Series Versus Price Momentum Weekly Year To Date Returns

Ultimate Series Versus Price Momentum Weekly Since Inception Returns
And the following table gives
another view of the improved performances:
Portfolio Name |
Performance Since
Jan-01-2005 |
Performance Since
Oct-12-2004 |
3 Best Trades |
3 Worst Trades |
|
|
-1.2% |
50.3% |
272.38% (CUX)
107.03% (WTL)
86.72% (AGA)
|
-28.89% (HLB)
-21.77% (ICS)
-20.71% (ZIC)
|
|
|
11.5% |
73.84% |
215.04% (CUX)
79.17% (AGA)
68.25% (WTL)
|
-23.62% (ICS)
-21.64% (ZIC)
-21.58% (FT)
|
|
|
5.1% |
58.71% |
128.21% (CUX)
70.97% (WTL)
65.02% (AGA)
|
-23.69% (ZIC)
-11.92% (GW)
-9.96% (KGI)
|
|
|
11.86% |
84.9% |
138.93% (CUX)
75.5% (WTL)
57.59% (AGA)
|
-11.92% (GW)
-9.6% (HLB)
-0.74% (MIG)
|
|
|
14.05% |
99.29% |
147.22% (CUX)
76.67% (WTL)
35.71% (HSG)
|
-8.05% (HLB)
-2.99% (GW)
2.29% (MIG)
|
|
|
13.05% |
105.36% |
159.48% (CUX)
63.08% (WTL)
43.06% (AGA)
|
-8.57% (HLB)
-1.47% (MIG)
4.56% (RRZ)
|
As it was expected, it can be noticed that the
delay filter has improved the overall return of the portfolios by removing a
lot of the short term bad trades. As a consequence, any of the Ultimate Price
Momentum portfolios performs better than the former Price Momentum Weekly portfolio,
and this, on any time frame we choose.
At the same time, we can also see that the best
trades have also been affected a bit by this buying delay, but not enough to
offset the increase in the quality of the trades.
Regarding the relative performance of the
different Ultimate Price Momentum portfolios, it is too early to draw a
conclusion on which one of them is the best performer. It seems that the
longer the delay, the better the performance, but it may be a
synchronization issue. Furthermore, the 2-week delayed portfolio has lost
some ground in the last month, but this does not mean that it is worse than
the other portfolios, it is only due to the fact that one of its stocks has
sunk while the portfolio was holding only two values.
To be continued in the
second part of this study where you learn how this delay filtering
strategy, on top of improving the performances of the portfolios, also
lowers the number of trades to execute and the number of
stocks to hold in those portfolios.
|
| |
|
|
|
|

